Bar Chart and Tables
Left Panel
The Grant Distribution by Funder Chart provides the user with information about which Funders provided Grants based on the selection criteria (e.g., Year, State, and/or City).
-
Grant Distribution by Funder Chart
- Funders (acronym)
- Number of Grants

Bottom Panel
The Grant Distribution by State Chart provides the user with a bar chart by State detailing the Grants awarded to Institutions within a given State. Similarly, Category Distribution Chart provides, Grant Distribution by nine Categories. A user is able to make an additional selection to filter results to explore individual States or Categories, or both.
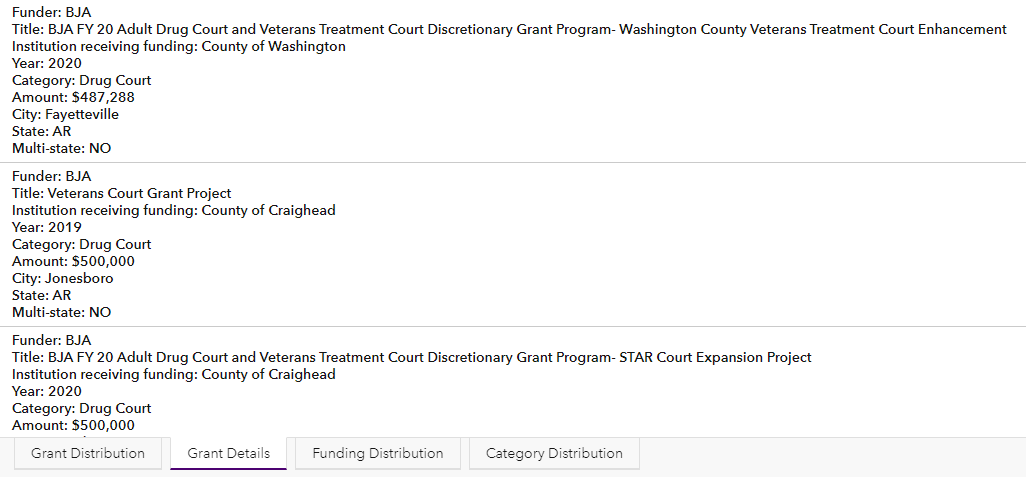
The Grant Details provides the user with a list detailing Grant-specific information, displayed in alphabetical order by Funder and then State. A user has the option to select a Grant to view the location of the Institution receiving funding on the map.
-
Grant Distribution (by state)
- X-axis – States
- Y-axis – Number of Grants
- Directional scroll bar

-
Funding Distribution (by state)
- X-axis – States
- Y-axis – Total Grant Amount
- Directional scroll bar

-
Grant Details
- Funder
- Title
- Institution receiving funding
- Year
- Category
- Amount
- City
- State
- Multi-state
-
Category Distribution
- X-axis – Funding Category
- Y-axis – Number of Grants
- Directional scroll bar
