JCOIN User Guide
| Description | User Guide for the JCOIN Dashboard |
| Author(s) | Parmanand Sinha |
| Copyright | Copyright © 2022 Maintained by Research Computing Center, UChicago. |
Overview
The JCOIN 2019-2020 Federal Funding Dashboard provides users with the opportunity to explore the allocation of federal funding across the United States to address the opioid crisis in criminal justice-involved populations for 2019 and 2020.
Depending on their search criteria, including State, City, Year, and Funder, users can explore Grants awarded across nine Funding Categories by nine different Funding Organizations, including two partnerships.
Funder List (acronym and full Funder name)
| Funder |
|---|
| BJA - Bureau of Justice Assistance |
| CDC - Centers for Disease Control and Prevention |
| COPS - Community Oriented Policing Services |
| HRSA - Health Resources and Services Administration |
| NIDA - National Institute on Drug Abuse |
| OJJDP - Office of Juvenile Justice and Delinquency Prevention |
| ONDCP - Office of National Drug Control Policy |
| OVC - Office for Victims of Crime |
| SAMHSA - Substance Abuse and Mental Health Services Administration |
Site Layout
Site Header
Details
- About the Project
- JCOIN Methods
- User Guide
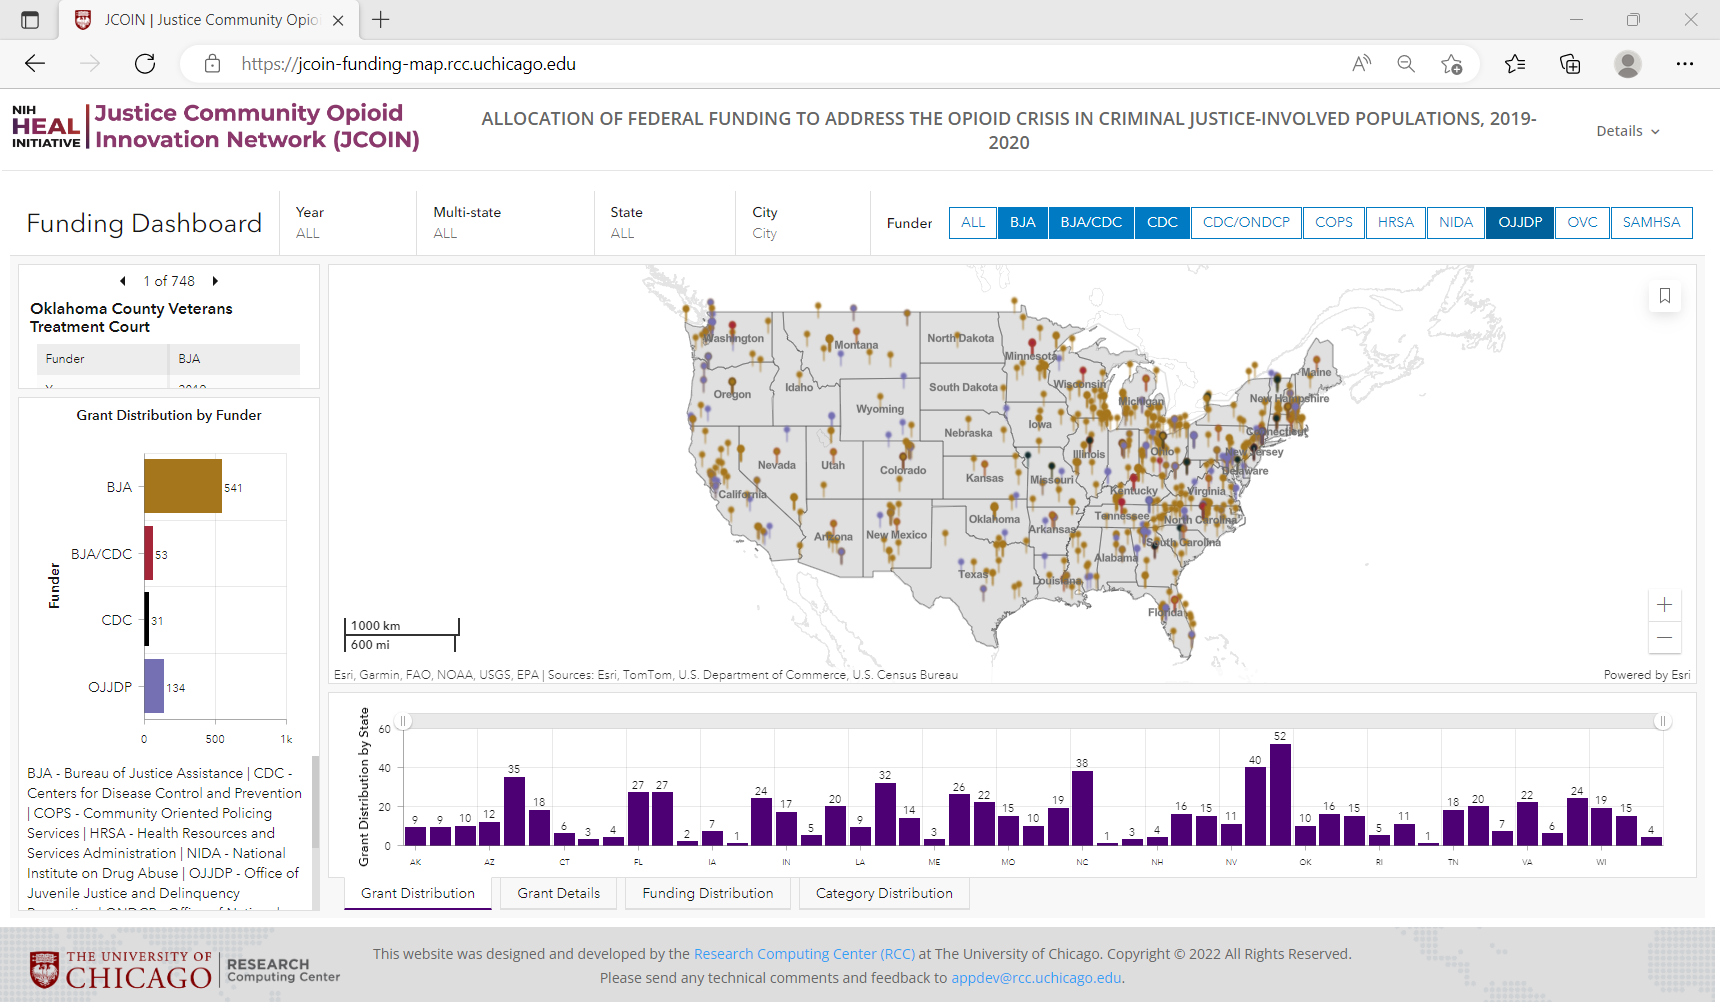
Dashboard Diagram

Dashboard Elements
| Drop down Menu | Bar Chart Menu | Left panel | Map Control |
|---|---|---|---|
| A - Year | F - Grant Distribution (by State) | J - Grant List | L - Zoom (+/-) |
| B - Multi-state Grants | G - Grant Details | K - Grant Distribution by Funder Chart | M - Bookmarks |
| C - State | H - Funding Distribution (by State) | ||
| D - City | I - Category Distribution | ||
| E - Funder |
Site Footer
Contact information
Bar Chart and Tables
Left Panel
The Grant Distribution by Funder Chart provides the user with information about which Funders provided Grants based on the selection criteria (e.g., Year, State, and/or City).
-
Grant Distribution by Funder Chart
- Funders (acronym)
- Number of Grants

Bottom Panel
The Grant Distribution by State Chart provides the user with a bar chart by State detailing the Grants awarded to Institutions within a given State. Similarly, Category Distribution Chart provides, Grant Distribution by nine Categories. A user is able to make an additional selection to filter results to explore individual States or Categories, or both.
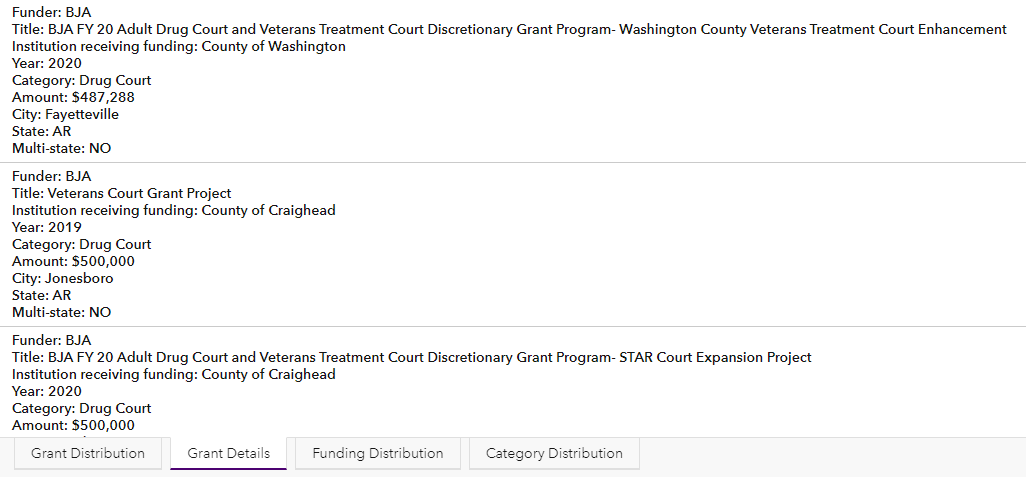
The Grant Details provides the user with a list detailing Grant-specific information, displayed in alphabetical order by Funder and then State. A user has the option to select a Grant to view the location of the Institution receiving funding on the map.
-
Grant Distribution (by state)
- X-axis – States
- Y-axis – Number of Grants
- Directional scroll bar

-
Funding Distribution (by state)
- X-axis – States
- Y-axis – Total Grant Amount
- Directional scroll bar

-
Grant Details
- Funder
- Title
- Institution receiving funding
- Year
- Category
- Amount
- City
- State
- Multi-state
-
Category Distribution
- X-axis – Funding Category
- Y-axis – Number of Grants
- Directional scroll bar

Query Filters
The dashboard provides the user the opportunity to filter their search results by Year, State, City, Funder, or any combination thereof.
Filter Menu
- A - Year
- B - Multi-state Grants
- C - State
- D - City
- E - Funder
Filtering using dropdown menus
Action
-
Select the desired Year from the drop down.
- 2019 or 2020 or both may be selected.
-
For Multi-state Grants Yes or No options are available.
-
Select the desired State from the drop down.
-
All States or a single State may be selected.
-
Only States with Grants will be available.
-
-
Select the desired City from the drop down.
-
Multiple Cities may be selected.
-
Only Cities with Grants will be available.
-
Results
-
Funder
- The Grant List (J in the Dashboard Diagram) will only display those that have Funded Grants in the selected State and Cities, if selected.
-
Map
-
Pinpoints that are color-coded to the applicable Funder will display in the selected State.
-
Click on the pinpoint and 6 lines of Grant related information will display in a pop-up.
-
-
Grant List
-
The number of associated Grants will display with the option to move forward or in reverse to view the list.
- For each Grant, the Title, Funder, Year, Funding, Grant number, Funding, Institution receiving funding, and Multi-state indicator will be viewable.
-
-
Grant Distribution by Funder Chart
-
The Funder acronym and the number of Grants will display.
-
The Funders are color-coded to match the pinpoint colors on the map.
-
-
Grant Distribution (by State), Grant Details, Funding Distribution (by State), and Category Distribution
-
Grant Distribution (by State) and Funding Distribution (by State)
-
The States with Grants will display
-
Depending on the number of States, the State abbreviations may not all appear on the x-axis. Using the directional scroll bar will allow the user to explore the unlabeled States.
-
Hover over any vertical bar and the State abbreviation and the number of Grants or Funding amount will display.
-
-
-
Grant Details
-
Grant details will display, alphabetized by Funder and then by State.
-
Selecting a Grant will update the map to the Grant location.
-
Select the Bookmarks button and then select home resolution to reset the map.
-
-
Category Distribution indicates the number of Grants in each of nine Funding Categories.
-
Select Year

Select State

Select City

Filtering by Funder

Action
-
Select the desired Funder
-
Multiple Funders may be selected.
-
NOTES
-
To deselect a Funder, click on the Funder Button again or click All.
-
A State and/or Cities may also be selected.
-
-
Results
-
Map
-
Pinpoints that are color-coded to the applicable Funder(s) will display .
-
Click on the pinpoint and six lines of Grant related information will display in a pop-up.
-
-
Grant List
-
The number of associated Grants will display with the option to move forward or in reverse to view the list.
- For each Grant, the Title, Funder, Grant number, and Institution receiving funding will be viewable.
-
-
Grant Distribution by Funder Chart
-
The Funder acronym and the number of Grants will display.
-
The Funders are color-coded to match the pinpoint colors on the map.
-
-
Grant Distribution (by State) Chart, Grant Details, Funding Distribution (by State) Chart, and Category Distribution
-
Grant Distribution (by State) and Funding Distribution (by State)
-
The States with Grants will display
-
Depending on the number of States, the State abbreviations may not all appear on the x-axis. Using the directional scroll bar will allow the user to explore the unlabeled States.
-
Hover over any vertical bar and the State abbreviation and the number of Grants or Funding amount will display.
-
-
-
Grant Details
-
Grant details will display, alphabetized by Funder and then by State.
-
Selecting a Grant will update the map to the Grant location.
-
Select the Bookmarks button and then select home resolution to reset the map.
-
-
Category Distribution indicates the number of Grants in each of nine Funding Categories.
-
Interactive Selection of Funder

Multiple Funder Selection
Interactive Selection
Grant Distribution by Funder Chart
The Grant Distribution by Funder Chart provides the user with information about which Funders provided Grants based on the selection criteria (e.g., Year, State, and/or City). A user is able to make additional selections to filter results to explore an individual Funder or a combination of Funders, as applicable.
Filtering on Funder
Action
-
Select the bar of the desired Funder
-
Only one Funder may be selected.
-
NOTE:
-
To deselect a Funder, click on the selected Funder bar OR click on the white space in the Chart.
-
The Funder bars not selected will be faded.
-
-
Results
-
Map
-
Pinpoints that are color-coded to the selected Funder will display.
-
Click on the pinpoint and six lines of Grant related information will display in a pop-up.
-
-
Grant List
-
The number of associated Grants will display with the option to move forward or in reverse to view the list.
- For each Grant, the Title, Funder, Year, Funding, Grant number, Institution receiving funding, and Multi-state indicator will be viewable.
-
-
Grant count (by State) Chart, Grant Details, Funding Distribution (by State) Chart, and Category Distribution
-
Grant Distribution (by State), and Funding Distribution (by State)
-
The States with Grants will display
-
Depending on the number of States, the State abbreviations may not all appear on the x-axis. Using the directional scroll bar will allow the user to explore the unlabeled States.
-
Hover over any vertical bar and the State abbreviation and the number of Grants or Funding amount will display.
-
-
-
Grant Details
-
Grant details will display, alphabetized by Funder and then by State.
-
Selecting a Grant will update the map to the Grant location.
-
Select the Bookmarks button and then select home resolution to reset the map.
-
-
Category Distribution indicates the number of Grants in each of nine Funding Categories.
-
Choosing the OJJDP bar on the chart only displays the Grants from the Office of Juvenile Justice and Delinquency Prevention as Funders on the map.

Grant Distribution (by State), and Category Distribution Chart
The Grant Distribution (by State) Chart provides the user with a bar chart by State detailing the Grants awarded to institutions within a given State. Similarly, Category Distribution Chart provides Grant Distribution by nine Categories.
Grant Details (by State) displays Grant-specific information alphabetically by Funder and then by State. Users can select a Grant to view a map showing where the institution receiving funding is located.
Filtering by State
-
Select the bar of the desired State in either the Grant Distribution chart or the Funding Distribution chart.
-
Only one State may be selected.
-
NOTE:
-
To deselect a State, click on the selected State bar OR click on the white space in the Chart.
-
The State bars not selected will appear faded.
-
-

Selecting KY from the Funding Distribution (by State) Chart, only grants from Kentucky are displayed.

Filtering on State, Funder, and Category Action
-
Select the bar of the desired State
-
Only one State may be selected.
-
NOTE:
-
To deselect a State, click on the selected State bar OR click on the white space in the Chart.
-
The State bars not selected will appear faded.
-
-
-
Select the bar of the desired Funder in the Grant Distribution by Funder Chart
-
Only one Funder may be selected.
-
NOTE:
-
To deselect a Funder, click on the selected Funder bar OR click on the white space in the Chart.
-
The Funder bars not selected will be faded.
-
-
-
Select the bar of the desired Category in the Category Distribution Chart
-
Only one Category may be selected.
-
NOTE:
-
To deselect a Category click on the selected Category bar OR click on the white space in the Chart.
-
The Category bars not selected will be faded.
-
-
Results
Combine the State, Funder, and Category filters. The state is filtered by Georgia, the funder is filtered by OJJDP, and the category is filtered by Drug Court.

Map options and control
Map pop ups Displays the following descriptive information about a Grant location when clicked.
- Forward/reverse arrows
- Zoom to
- Pan
- Forward/reverse arrows
- Title of Grant
- Funder
- Year
- Funding
- Grant number
- Institution receiving funding
- Multi-state
Scale bar Displays a scale bar in the lower left section of the map.

Default Map Extent and Bookmarks Provides preexisting bookmarks on the map.
Zoom (+/-) Zooms in and out on a map.
Maps can be scaled back to their initial layout by clicking the default map resolution button
